

Charting isn’t a one-size-fits-all activity. All traders have their own goals and unique approaches. In this guide, you’ll get a quick-hit overview of a few major chart analysis styles. You’ll learn what drives each style, the tools they use, and the pros and cons of each. Take a look and see whether one resonates with your own trading personality.
When it comes to analyzing charts, everyone’s wired differently. Some like to ride trends. Others have a knack for spotting patterns. Some chase momentum. Others like to decipher candlesticks.
What you’re about to read is a lightning round of the major tribes of chart analysis. I’ll present you with a bulleted summary of the main ideas, tools, and pros and cons of each approach, followed by a short commentary. Maybe one or a few might resonate with you, or perhaps you’ll want to mix and match several approaches.
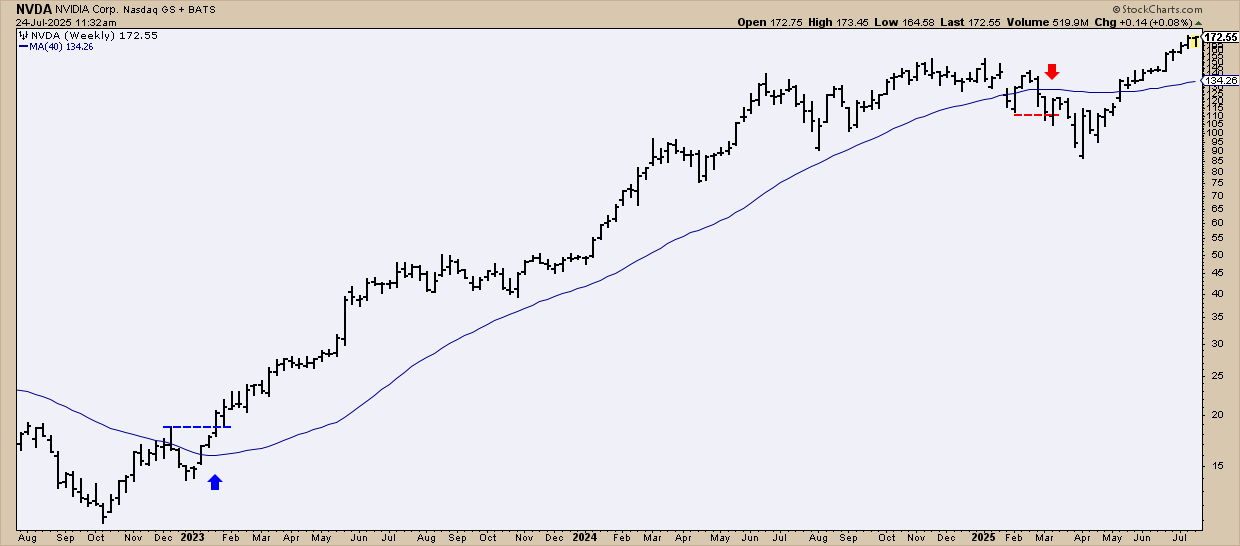
FIGURE 1. WEEKLY CHART OF NVIDIA: In this example, a trader using the 40-week simple moving average (SMA), equivalent to a 200-day SMA, might have opened a long position upon a breakout of the swing high above the 40-week SMA (blue arrow), closing a profitable position once price fell below a swing point below the 40-week SMA (red arrow).
Trend following is a classic approach that lends itself well to longer-term position trading. Of course, there are shorter trends as well, and these are what swing traders typically trade. The main things to watch out for here are whipsaws.
Longer-term trend following approaches that are always in the market (going long and short) can generate big returns, but they may also come with many smaller losses and large drawdowns when markets move sideways. A longer-term approach requires patience, higher risk tolerance, and adequate capital to pull it off. If not, a shorter swing trading approach might be more suitable. It’s up to you. Study and backtest it thoroughly before jumping in.

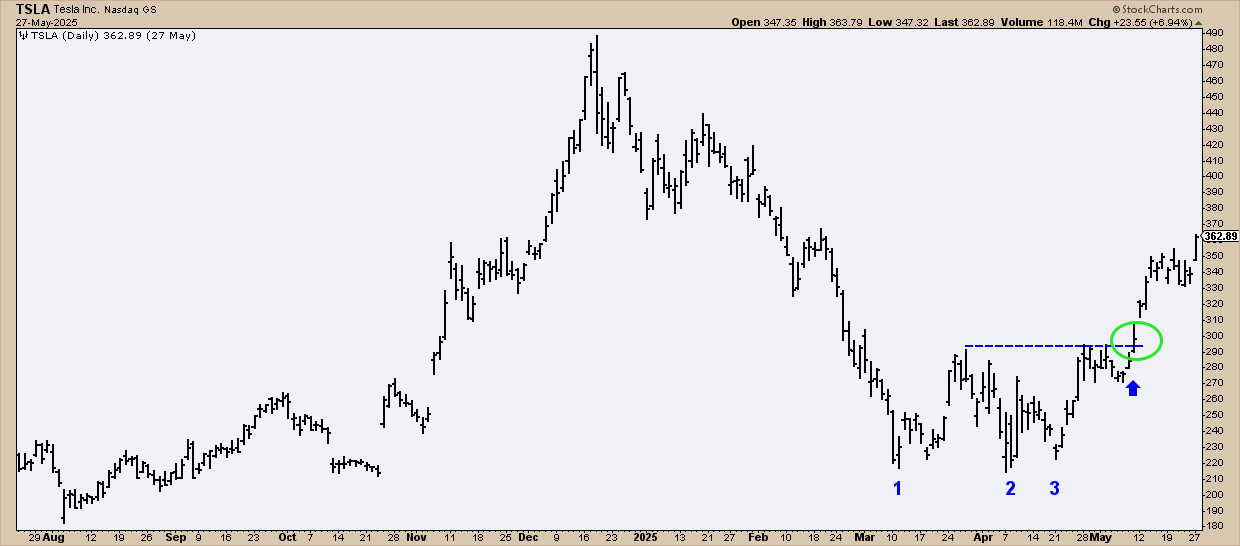
FIGURE 2. DAILY CHART OF TESLA. In this example, a pattern hunter might have identified the triple bottom, going long upon a breakout of the peak of the formation (blue line, arrow, and circle), hoping the rally will develop into a stronger uptrend.
Spotting a classic pattern in its “textbook” form can be quite exhilarating. This means the pattern is super clear and meets all of the requirements. In the real world, pattern shapes aren’t always clear, and they don’t always check all the boxes to meet classic criteria. This can get tricky because you now have to decide whether to trust the pattern or not.
Plus, even the most pristine patterns can fail. But the good news is that the classic approach to these patterns comes with complete setups, such as various exit points for when they fail, and price targets for when they succeed.
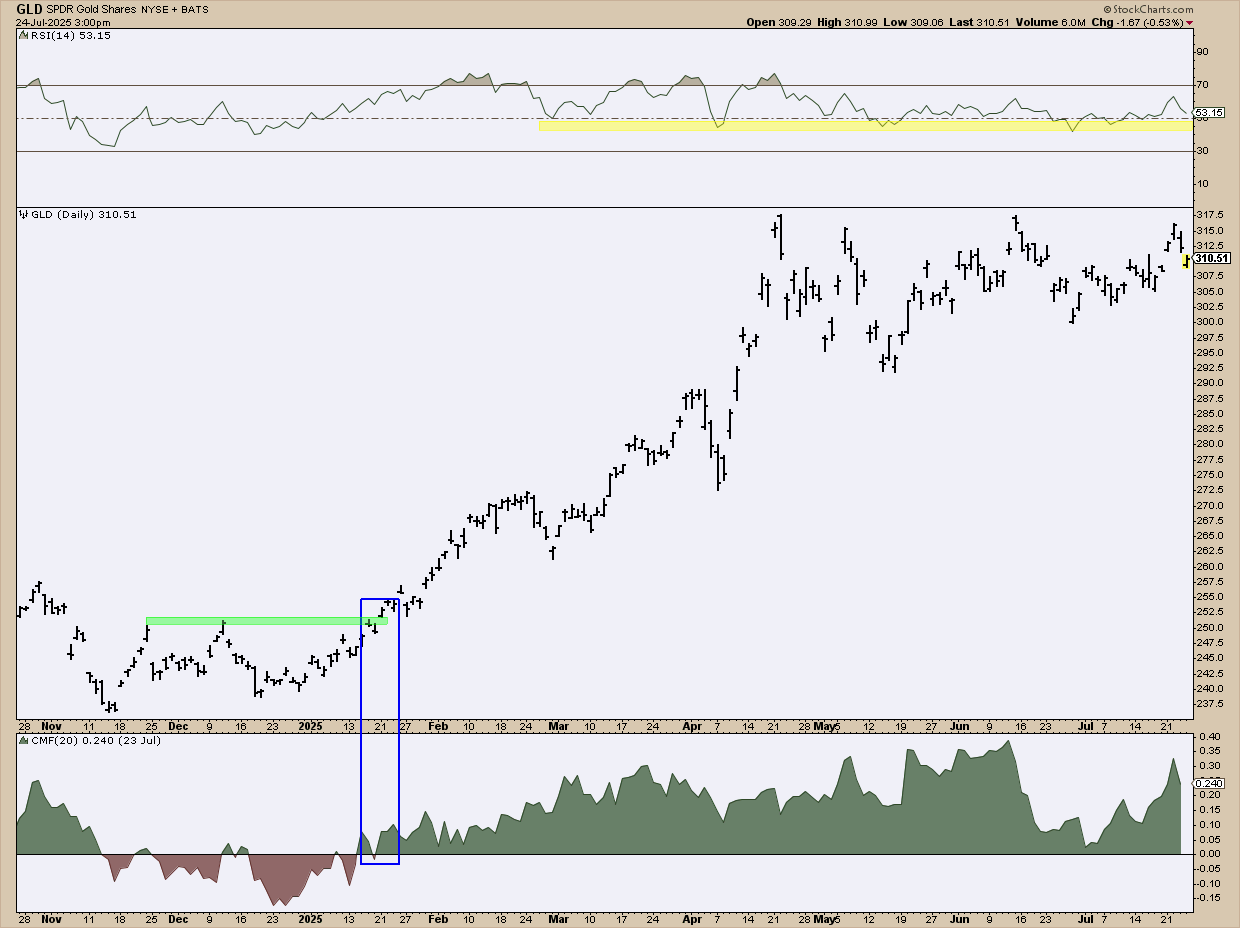
FIGURE 3. DAILY CHART OF SPDR GOLD SHARES ETF. There are many ways to gauge momentum. In this example, a trader might have looked at the RSI (which tends to range between 40 - 90 during a bull market) and the positive buying pressure in the Chaikin Money Flow (CMF) as a green light to open a long position upon a breakout of the November - January trading range (green shaded line and blue rectangle).
All big moves in the market require strong momentum and volume to drive and sustain them. That’s why strong momentum and volume precede large swings. However, momentum can be volatile, depending on what’s going on in the market and the broader economy.
Sudden developments, news events, economic reports, and other factors can quickly shift market sentiment and momentum, either in your favor or against it. So, if you’re going to adopt this approach, you’ll have to keep an eye on the market and be able to make quick decisions if momentum happens to shift against your position.
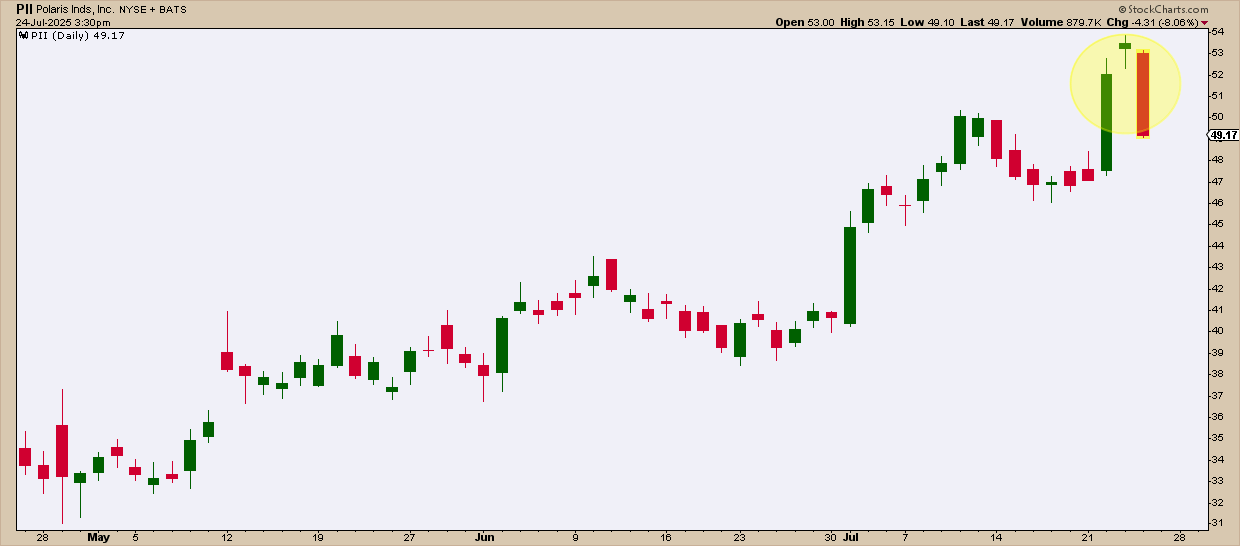
FIGURE 4. DAILY CHART OF POLARIS. This evening star candlestick pattern is a bearish pattern signaling a potential reversal to the downside.
Once you master the universe of candlestick patterns, not only are the patterns easy to spot, but each will tell you a story about what the market was thinking as it formed the patterns. There’s something powerful about reading an entire session’s activity from a single candle.
Still, there are other factors affecting a market. While candlesticks can give a strong clue, you may have to use other tools to confirm the story, especially if you’re going to put your money on it.
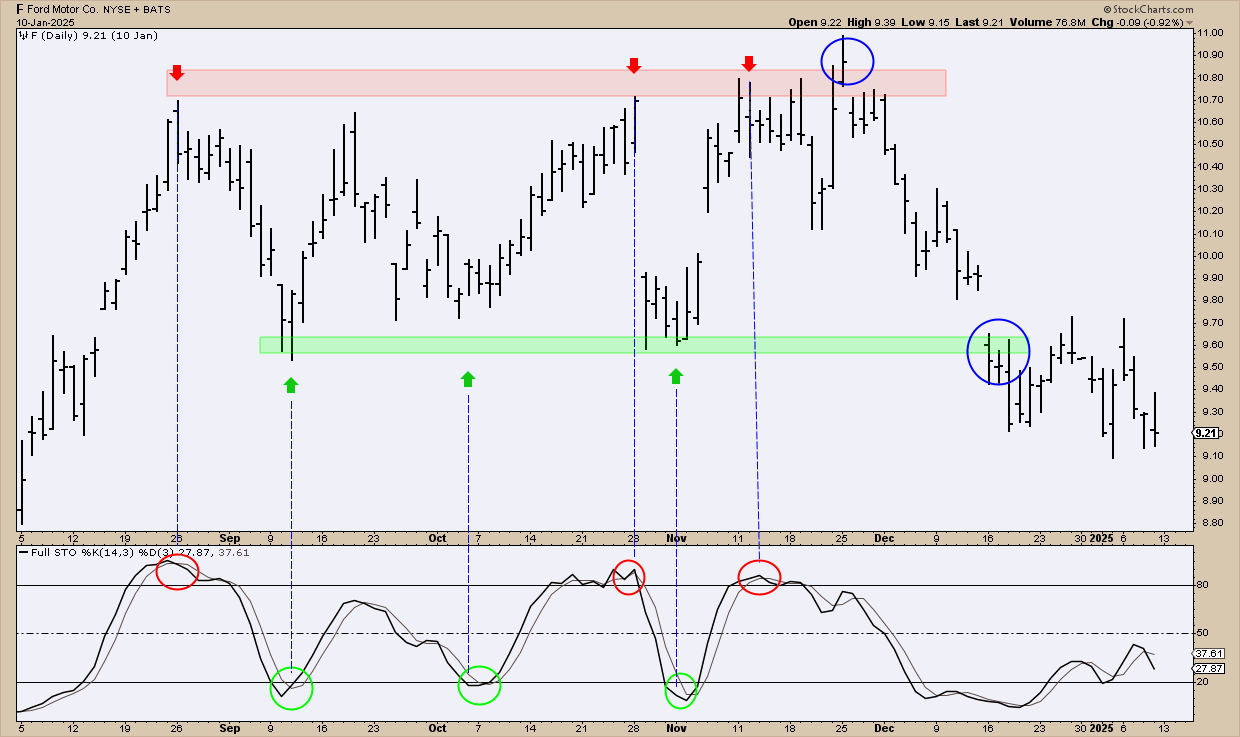
FIGURE 5. DAILY CHART OF FORD. A range scalper might have combined support and resistance ranges with the Stochastic oscillator to go long (green arrow) and short (red arrow) when the stock entered oversold and overbought areas. The blue circles show where price exceeded support and resistance, potentially generating losses.
If markets trade within a definable range between 60% to 80% of the time, that opens the door to plenty of scalping opportunities. Small wins can stack up. And while you can stick to long-only setups, many scalpers play both sides, going long and short, to maximize a range-bound formation.
But there’s a catch: Price doesn’t always respect support and resistance levels; it can push beyond them, sometimes by a lot, before reversing. That makes stop-loss placements tricky, and this is where it can get frustrating: Getting stopped out only to see price reverse and move in your original direction.
In the worst-case scenario, price may break out of the range. When it does, it often happens with speed and force. If your stop is too wide or non-existent, you can take a big hit. So be careful with this high-risk strategy.
There are other chart analysis approaches, of course. Many traders will even fuse these approaches or master a few of them to match different market scenarios. Find what clicks with your mindset, timeframe, and risk tolerance. Whatever you decide, StockCharts has the tools for pretty much all of it.
Disclaimer: This blog is for educational purposes only and should not be construed as financial advice. The ideas and strategies should never be used without first assessing your own personal and financial situation, or without consulting a financial professional.
About the author:
Feeling confident about your investment decisions can be difficult. We get it. At StockCharts, we're investors too. StockCharts was founded 25 years ago to help investors cut through the noise of the markets using the best market data, technical charts, and trading analysis tools in the world.
Our award-winning flagship product, SharpCharts, is the gold standard for online technical analysis. SharpCharts provides you with an intuitive and comprehensive set of tools to analyze market trends and make informed trading decisions.
Create large, advanced charts
Real-time Intraday Data
Technical Indicators and Overlays
Auto-refresh
Candlesticks, lines, bars, and much more
Here’s what a few have to say about us:
"I have learned a lot over the past 5 years and have carved out a style of trading that is within my risk threshold and provides me a way to find excellent setups with terrific risk-reward. I owe StockCharts a debt of gratitude for building such a robust system... Thanks again!"
The more I read and study from trading pros, the more I appreciate all of the wonderful tools available on your website. I’m becoming a smarter and “better-educated trader” as I continue learning from your seasoned experts, videos, and trading tools. Trading is no longer a hobby. It’s now a part-time home-based business for me. Thank you all for what you do.
Our Charts Have Been Seen On